
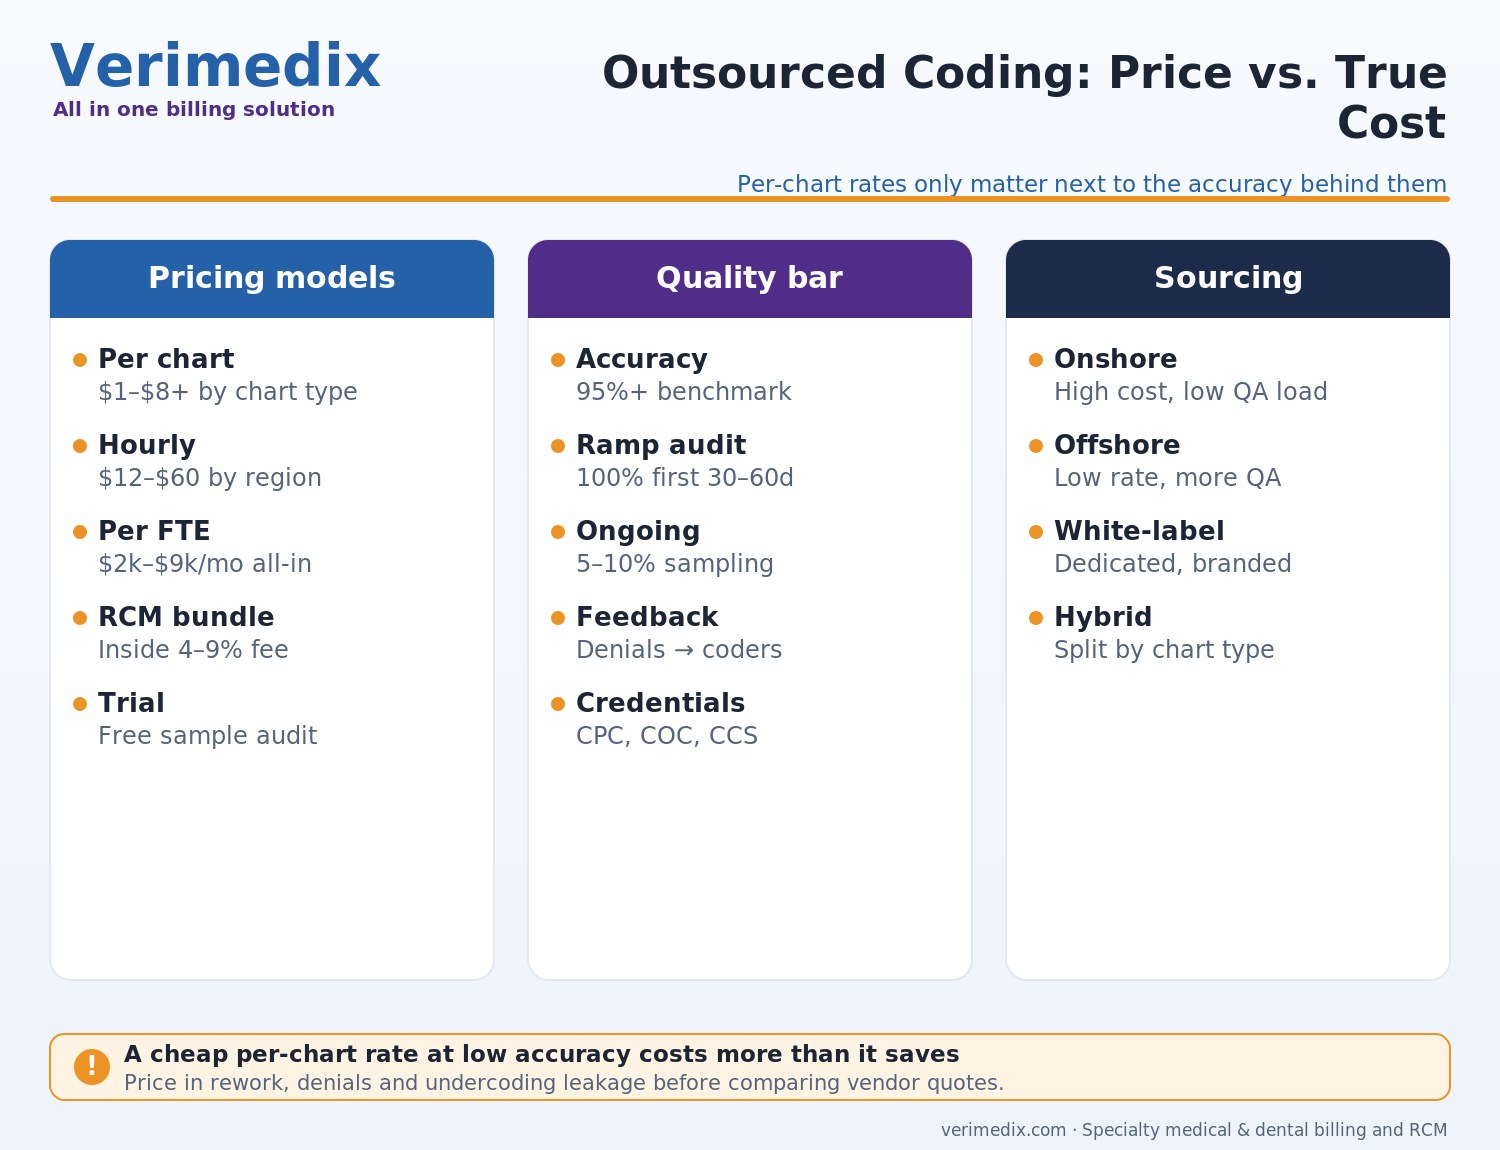
- Outsourced medical coding is priced four ways in 2026: per chart (roughly $1–$8+ by chart type), hourly ($12–$25 offshore, $28–$60+ onshore), per dedicated FTE per month, or bundled into a percentage-of-collections RCM fee.
- Per-chart price means nothing without the accuracy behind it — a cheap rate at low accuracy costs more than a premium rate at 97–98% once you price in denials and rework.
- The industry quality bar is 95%+ coding accuracy, verified by audit: expect 100% review during a 30–60-day ramp, then ongoing sampling (commonly 5–10%) with documented feedback loops.
- HFMA-published research found offshore coders were 34% less productive per hour and required significantly more audit time — offshore savings are real but smaller than the rate gap suggests.
- Three sourcing models — onshore, offshore, and white-label dedicated teams — trade cost against oversight burden and continuity; hybrids are increasingly common.
- Vet vendors on credentials (CPC, COC, CCS, specialty certifications), audit methodology, denial feedback loops, and a free sample-chart audit before signing anything.
What outsourced coding actually covers
Coding vendors sell more than code assignment. A full engagement typically spans: abstraction and code assignment (ICD-10-CM, CPT®, HCPCS, and modifiers) from clinical documentation; NCCI edit and LCD/NCD screening before claims go out; coding-related denial review and appeal support; documentation-improvement feedback to providers; periodic internal audits with reported accuracy; and backlog cleanup projects. Scope varies widely, so the first vetting question is simply: which of these are in the quote, and which are billable extras? Coding is also frequently bundled inside larger billing engagements — if you are evaluating that route, start with our guide to medical billing outsourcing companies and models.
Pricing models: what coding vendors charge in 2026
Published vendor guides and rate cards cluster around four structures. Ranges are typical market figures — specialty, volume and documentation quality all move quotes. For practices that want dedicated coders without agency markups, Verimedix's White-Label Workforce model assigns named, credentialed coding staff who work inside the client's systems under the client's brand, with role-based monthly pricing rather than per-chart fees.
| Pricing model | Typical 2026 range | Best for | Watch for |
|---|---|---|---|
| Per chart / per encounter | ~$1–$4 for professional-fee E/M; $4–$8+ for surgical, specialty and facility charts; inpatient DRG coding higher still | Variable volume; easy vendor comparison | Rate quoted without an accuracy guarantee; rework billed separately |
| Hourly | $12–$25 offshore; $28–$60+ onshore credentialed coders | Backlogs, audits, project work | Productivity varies — hourly hides charts-per-hour differences |
| Dedicated FTE / month | Roughly $2,000–$4,000 offshore to $6,500–$9,000+ onshore per coder, all-in | Steady volume; specialty continuity | Utilization — pay for a full coder, keep them fed with charts |
| Bundled in RCM % | Folded into a 4–9%-of-collections billing fee | Practices outsourcing the whole revenue cycle | Coding quality invisible unless separately reported |
Volume discounts are standard above a few thousand charts monthly, and most reputable vendors will code a free sample batch — use it as an audition, not a formality. Send charts your own team found tricky and compare the vendor’s codes against an independent audit.
Quality controls: the numbers a vendor must show you
Accuracy is the entire product. The industry convention — used by AAPC- and AHIMA-credentialed audit programs — benchmarks acceptable coding accuracy at 95%, and top vendors advertise 97–98%. But the advertised number matters less than the machinery that produces it. Demand specifics on four controls:
- Audit rate and cadence. Expect 100% review of a new coder’s work during a 30–60-day ramp, stepping down to ongoing random sampling — commonly 5–10% of charts — plus focused audits on high-risk code families. Ask who performs audits and whether auditors are independent of production coders.
- Accuracy definition. Chart-level accuracy (was the whole chart right?) is a tougher standard than code-level accuracy (what share of individual codes were right?). Vendors quoting 98% code-level may run closer to 90% chart-level. Make them define it in the contract.
- Denial feedback loop. Coding-related denials (CO-11, modifier and NCCI edits, medical-necessity mismatches) should route back to the coder who worked the chart, with tracked root causes — not disappear into a rebill queue.
- Credential mix. CPC (professional fee), COC (outpatient facility), CCS and CIC (inpatient), plus specialty credentials where relevant. Ask what percentage of the team assigned to you is credentialed and how continuing education is maintained through annual code updates.
Onshore vs. offshore vs. white-label: the honest comparison
The rate gap between onshore and offshore coding is large; the true cost gap is smaller. Comparative research published by HFMA found offshore coders were about 34% less productive per hour than domestic coders, required roughly 51% more headcount for the same volume, and needed several additional hours of quality review per coder per month — adding meaningfully to the effective rate. Offshore still usually wins on cost, but by less than the hourly numbers imply, and the QA burden lands on someone. The third path — a white-label billing workforce — puts dedicated, vendor-managed coders under your brand and SOPs, with supervision and QA included, priced between commodity offshore and onshore rates.
| Dimension | Onshore | Offshore BPO | White-label dedicated team |
|---|---|---|---|
| Typical cost | $28–$60+/hr; highest FTE cost | Lowest rates ($12–$25/hr) | Between the two, per-FTE monthly |
| Effective cost after QA | Close to sticker | Higher than sticker (audit time, rework, extra headcount) | Near sticker — QA layer is included |
| Continuity | Tight labor market, poaching risk | Pool-based; coders rotate across accounts | Named coders dedicated to your account |
| Specialty depth | Strong, expensive | Varies by vendor and account tier | Recruited to your specialty mix |
| Oversight burden | Low | Highest — you own the QA program | Low — vendor-managed with your SOPs |
| Brand & workflow | Yours | Vendor’s process, your data | Your brand, your systems, their management |
Many groups land on hybrids: onshore or white-label leads for complex surgical and inpatient charts, offshore capacity for routine E/M volume, with a follow-the-sun handoff. For the wider staffing math — roles, ratios and build-vs-buy — see our RCM staffing guide.
Worked example: cheap rate vs. true cost (illustrative)
A hypothetical multispecialty group sends 2,000 charts a month to one of two vendors:
- Vendor A: $3.00 per chart at 94% chart-level accuracy — $6,000/month. 120 charts/month carry errors; assume half trigger a denial or rework at ~$30 of staff time and delay cost each: $1,800/month. Effective cost: $7,800, plus whatever underpayments and audit exposure survive rework.
- Vendor B: $4.25 per chart at 98% accuracy — $8,500/month. 40 error charts, ~$600 of rework: effective $9,100.
- The catch: Vendor A looks $1,300 cheaper — until you add the softer costs: 80 extra denied or reworked claims aging your AR, provider frustration, and undercoding leakage that never gets caught. If even 15 of those 120 error charts undercode a visit by $40, Vendor A’s advantage is gone entirely.
Figures are illustrative, but the method is the takeaway: multiply the error rate by your rework cost and average reimbursement before comparing per-chart quotes.
Seven questions that separate coding vendors
- What is your chart-level accuracy, how is it audited, and can I see a redacted audit report?
- Will you code a free sample batch of my toughest charts for independent review?
- Who exactly codes my charts — credentials, location, dedicated or pooled — and what is their tenure?
- How do coding-related denials flow back to coders, and what root-cause reporting do I receive?
- How do you handle annual ICD-10/CPT® updates and payer-specific edits — and who pays for retraining time?
- What are turnaround times by chart type, and what happens during volume spikes or coder absences?
- What are the BAA, data-security and offboarding terms — and do I keep audit documentation if we part ways?
If the answer to the staffing questions keeps coming back “it depends on the pool,” you are buying capacity, not a team. Practices weighing an in-house hire instead should run the numbers in our guides to hiring a medical coder and vetting medical coding staffing agencies before committing either way.
Quick Answers
How much does it cost to outsource medical coding? Typical 2026 market rates run about $1–$4 per chart for professional-fee E/M coding, $4–$8+ for surgical and specialty charts, $12–$25 per hour offshore or $28–$60+ onshore, and roughly $2,000–$9,000 per dedicated coder per month depending on region and credentials.
What accuracy rate should an outsourced coding vendor guarantee? The industry benchmark is 95% or better, with top vendors advertising 97–98%. Insist on the definition (chart-level vs. code-level) and on audit evidence, not just the marketing number.
What audit rate is normal for outsourced coding? 100% review during a new coder’s first 30–60 days, then ongoing random samples — commonly 5–10% of production — plus targeted audits of high-risk codes. Auditors should be independent of the production team.
Is offshore medical coding cheaper than onshore? Usually, but by less than hourly rates suggest: HFMA-published research found offshore coders needed more headcount and more audit time for the same output. Net savings persist for routine volume; complex charts often justify onshore or dedicated-team coverage.
What is white-label coding staffing? A model where the vendor recruits, trains and manages coders who are dedicated to your organization and work under your brand and SOPs — combining offshore-style economics with named-team continuity and included QA.
Frequently asked questions
It depends on volume and specialty mix. A credentialed in-house coder often costs $75,000–$100,000 fully loaded and makes sense once you have steady full-time volume in one specialty; outsourcing wins for variable volume, multi-specialty groups, backlogs and hard-to-recruit markets. Many practices run a hybrid — in-house lead plus outsourced capacity.
Look for AAPC and AHIMA credentials matched to your chart types: CPC for professional-fee coding, COC for outpatient facility, CCS or CIC for inpatient, plus specialty credentials where relevant. Ask what share of the team assigned to your account is credentialed and how annual code-update training is handled.
24–48 hours is a common standard for routine professional-fee charts, with longer windows for complex surgical or inpatient records. What matters most is consistency and a stated plan for volume spikes — slow coding delays claims and quietly inflates days in AR.
It shifts rather than removes it: your organization remains responsible for claims submitted under its NPIs. Mitigate with a signed BAA, defined accuracy standards in the contract, independent audits, and the right to review the vendor's audit documentation. Undercoding is a compliance and revenue issue just as overcoding is.
Yes — partial arrangements are common: overflow-only, specific specialties, backlog projects, or audit-and-education engagements while your team keeps production coding. A sample-batch pilot on one chart type is the lowest-risk way to test a vendor before wider rollout.