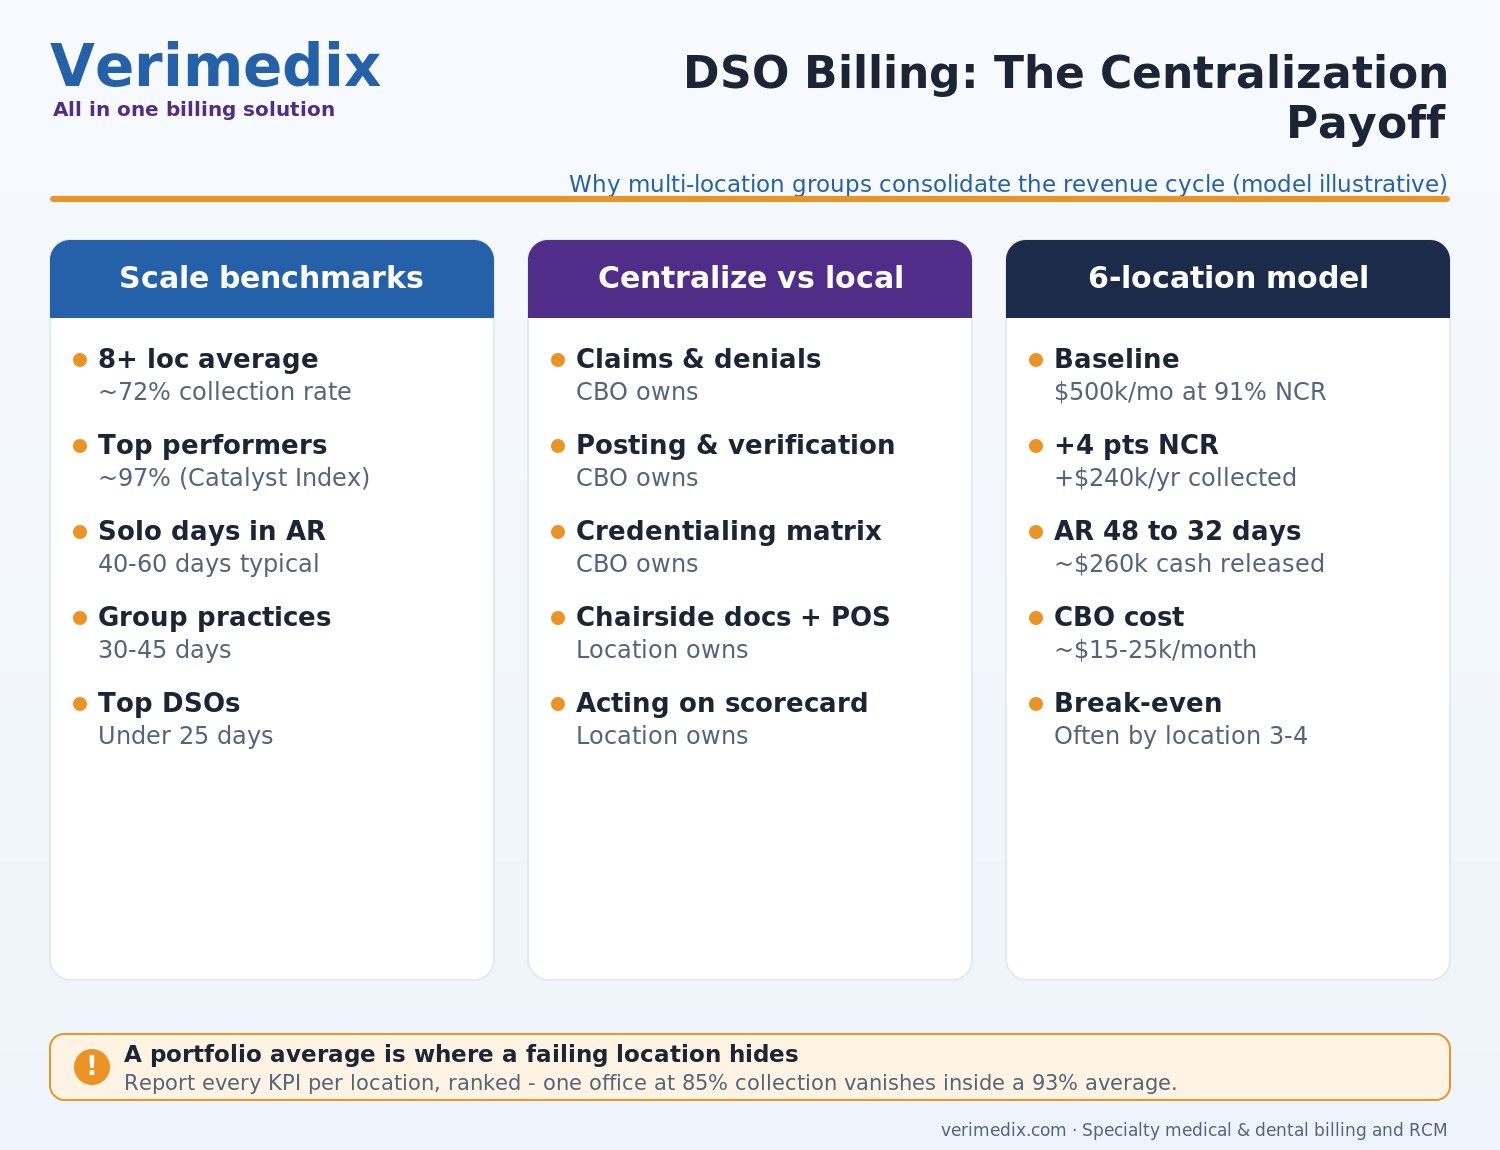
- Collection performance degrades with scale when billing stays fragmented: Henry Schein One’s 2026 Catalyst Index data shows groups with 8+ locations averaging collection rates around 72%, while top performers reach roughly 97% — the spread is operational, not clinical.
- A centralized billing office (CBO) standardizes fee schedules, coding audit, claim submission, denial work and AR follow-up, while each location keeps scheduling, chairside documentation and patient-facing collections.
- Credentialing is a multiplication problem: providers × payers × locations. Groups that reach sufficient size can pursue delegated credentialing agreements with payers to compress enrollment timelines.
- KPI dashboards must report per location, not just portfolio averages — days in AR, net collection rate, clean-claim rate, denial rate and AR>90 by office, benchmarked against each other.
- Days-in-AR benchmarks published for dentistry suggest solo offices commonly run 40–60 days while well-run centralized groups push under 25–30 — centralization is what moves the number.
- Build vs outsource is not binary: many DSOs centralize governance and analytics in-house while outsourcing execution capacity (verification, claims, AR) to scale without hiring waves.
Why per-location billing breaks at scale
Acquire five practices and you inherit five billing cultures: different fee schedules, different write-off habits, five private systems for working denials, and zero comparability between offices. Nothing is technically broken — which is the problem, because nothing is measurable either.
Industry benchmarking is blunt about the cost: Henry Schein One’s 2026 Catalyst Index reports an average collection rate near 72% for groups with 8+ locations against roughly 97% for top performers, and dental days-in-AR benchmarks published by RCM analytics vendors show solo practices at 40–60 days, group practices at 30–45, and top-performing centralized organizations under 25. On $20M of annual production, each point of collection rate is $200,000 — fragmentation is the most expensive “working fine” in dentistry. For revenue cycle fundamentals underneath all of this, see our complete dental RCM guide.
What a centralized DSO billing model looks like
Centralization is a division of labor, not a land grab. The functions that benefit from consolidation are the ones where consistency and specialization compound; the functions that must stay local are the ones attached to the patient in the chair.
| Function | Centralize (CBO) | Keep at location |
|---|---|---|
| Insurance verification | Batch verification 2–3 days ahead for all offices | Day-of walk-in checks, patient conversations |
| Fee schedules & contracts | Single source of truth; PPO negotiation leverage across the portfolio | — |
| Claims & attachments | Standardized scrubbing, submission and attachment rules | Clinical documentation quality at the source |
| Payment posting | Centralized ERA posting with standardized adjustment codes | Point-of-service patient collections |
| Denials & appeals | Specialized denial team working cross-location queues by payer | Supplying clinical narratives when requested |
| AR follow-up | Deadline-driven worklists across all locations | Patient balance conversations at checkout |
| Credentialing | Enrollment matrix, CAQH maintenance, delegated agreements | Alerting CBO to new hires and schedule changes early |
| Analytics | Location-level KPI dashboards, benchmarked | Acting on their own numbers |
Sequence matters: standardize adjustment and write-off codes first, then centralize posting, then claims, then denials and AR. Groups that flip everything at once usually spend two quarters untangling data definitions.
Credentialing at scale: the multiplication problem
A solo dentist enrolls with perhaps 10–15 payers once. A 12-location DSO with 40 providers and 15 payers is managing up to 600 provider-payer relationships — before counting location adds, each with its own effective date. Every gap is concrete money: an uncredentialed associate seeing PPO patients at a new office generates claims that deny or price out-of-network from day one.
The scale playbook, in order of leverage:
- Build the enrollment matrix — providers × payers × locations with status and effective dates — before anything else. Most inherited credentialing chaos is simply the absence of this table.
- Start enrollment at the offer letter, not the start date. Payer enrollment commonly takes roughly 60–120+ days depending on the payer; a 90-day head start is the difference between billable day one and a quarter of parked claims.
- Maintain CAQH centrally with a re-attestation calendar; expired attestations quietly stall applications.
- Pursue delegated credentialing once you have scale. Larger groups can contract with payers to perform credentialing themselves under NCQA-consistent standards, with the payer auditing the process — compressing effective dates from months to weeks. Payers set their own eligibility thresholds; it is worth asking your largest payers where theirs sit.
- Track recredentialing as rigorously as initial enrollment — a lapsed recredentialing terminates participation just as effectively as never enrolling.
Our dental credentialing services guide covers per-provider costs and timelines, and the general mechanics are in our provider credentialing checklist.
The KPI dashboard: per location or it doesn’t count
A portfolio average is where problems hide. The dashboard that actually manages a DSO reports each metric per location, ranked, with the portfolio number as context:
| KPI | Common benchmark (dental, cautious) | What a per-location miss tells you |
|---|---|---|
| Net collection rate | ≥95–98% of collectible production | Write-off discipline or AR follow-up failing at that office |
| Days in AR | Under ~30–35; top groups under 25 | Charge lag, slow posting or stalled claims locally |
| Clean-claim rate | ≥95% accepted first pass | Front-desk data capture or attachment habits at that office |
| Denial rate | Commonly held under ~5–10% of claims | Verification gaps or documentation patterns by provider |
| AR > 90 days | Often targeted under ~15–20% of total AR | Backlog forming; triage before timely filing losses |
| Verification completion | 100% of scheduled patients 48h ahead | The single best leading indicator of next month’s denials |
Benchmarks are directional — payer mix and specialty mix shift them — but ranking your own locations against each other is always valid. The rhythm: weekly CBO review of rejections and denials, monthly location scorecards, quarterly deep-dives where the bottom office adopts the top office’s playbook. Deeper measurement mechanics live in our guide to days in AR.
Worked example: what centralization is worth (illustrative)
Illustrative model: a 6-location group producing $500,000/month collectively, collecting at 91% net, days in AR at 48.
- Centralization program lifts net collection rate from 91% to 95% — four points × $500,000 = $20,000/month, $240,000/year in additional collections on the same dentistry.
- Days in AR falling from 48 to 32 releases roughly $260,000 of cash one time (16 days × ~$16,400 average daily collections) as the backlog converts.
- Against that: CBO cost (a lead + specialized billers or an outsourced partner), realistically $15,000–$25,000/month at this scale depending on build vs buy.
The model is illustrative, but the shape is reliable: centralization pays for itself when the collection-rate lift on portfolio production exceeds the CBO cost — which is why it pencils earlier than most groups expect, often around the third or fourth location.
Build the CBO or outsource it?
Three honest paths, and a hybrid most groups end up choosing: DSOs weighing build-versus-buy can also blend the two: Verimedix's embedded-staffing model adds centralized billing capacity across locations under the DSO's own brand, scaling seats per location without a vendor migration.
- Build: full control and institutional knowledge, but you are hiring, training and retaining a specialized team in a tight labor market — and dental billing talent shortages are well documented (see our piece on dental staffing challenges). Budget for redundancy: a two-person CBO is one resignation from crisis.
- Outsource: full-cycle dental RCM services bring trained capacity, existing playbooks and elastic scale for acquisitions — typically priced as a percentage of collections or per-location fees. You trade some control and must manage the vendor with the same KPI dashboard you would use internally.
- Hybrid (most common at 5–20 locations): keep RCM leadership, analytics and payer strategy in-house; outsource execution lanes — verification, claims, posting, AR follow-up — so acquisitions onboard without hiring waves.
The deciding questions: Can you hire and retain the team? Do you have playbooks, or would you be inventing them? How fast are you acquiring — and does your billing capacity scale at acquisition speed or hiring speed?
Quick Answers
What is DSO billing? DSO billing is the revenue cycle operation of a dental support organization — managing verification, claims, posting, denials, AR and credentialing across multiple locations, typically through a centralized billing office (CBO) that standardizes processes portfolio-wide.
Why do DSOs centralize billing? Because fragmented, per-location billing degrades measurably at scale: benchmarking such as Henry Schein One’s 2026 Catalyst Index shows large multi-location groups averaging collection rates near 72% while top performers reach about 97%. Centralization standardizes process, concentrates expertise and makes every location comparable.
What KPIs should a DSO billing dashboard track? Per location: net collection rate (≥95–98%), days in AR (under ~30, best-in-class under 25), clean-claim rate (≥95%), denial rate, AR over 90 days, and verification completion 48 hours ahead — each benchmarked office against office.
What is delegated credentialing for DSOs? An arrangement where a payer authorizes a sufficiently large, audited organization to credential its own providers under NCQA-consistent standards, compressing enrollment from months to weeks. Eligibility thresholds are payer-specific, so larger DSOs should ask their top payers directly.
Should a DSO build or outsource its billing office? Under roughly 3–5 locations, outsourcing usually wins on cost and speed; fast-acquiring groups favor hybrid models — in-house RCM leadership and analytics with outsourced execution capacity — because vendor capacity scales at acquisition speed while hiring does not.
Frequently asked questions
There is no magic number, but the economics commonly pencil around the third to fourth location — the point where duplicated billing labor, inconsistent write-offs and lost comparability cost more than a small CBO or outsourced equivalent. Fast-acquiring groups often centralize earlier so each new practice onboards into an existing system rather than adding another billing culture.
Split the work deliberately: the CBO owns claims, denials, posting and AR; locations own documentation quality, point-of-service collections and acting on their scorecards. Publish per-location KPIs monthly and rank them — accountability improves when offices see their numbers next to their peers', which is impossible under fragmented billing.
Credentialing and data definitions. Providers at the acquired office need enrollment under the new tax ID/entity with every payer — a 60-120+ day process that should start during diligence, not after closing — and the acquired practice's adjustment codes rarely match yours, which corrupts portfolio reporting until mapped.
It helps enormously but is not a prerequisite. Many DSOs run a centralized billing team across mixed PMS environments using standardized workflows and a reporting layer that normalizes KPIs. Consolidating systems accelerates everything, but waiting for a portfolio-wide PMS migration to centralize billing usually costs more than working across systems in the interim.
With exactly the dashboard you would use internally: per-location net collection rate, days in AR, clean-claim rate, denial rate and AR>90, reviewed monthly against contractual expectations. Insist on transparency into claim-level work queues, root-cause denial reporting, and a named team — portfolio averages from a vendor deserve the same skepticism as portfolio averages from anywhere else.